What is variance analysis between actual and standard costs (material, labor variances)?
Variance Analysis
What is variance analysis between actual and standard costs (material, labor variances)?
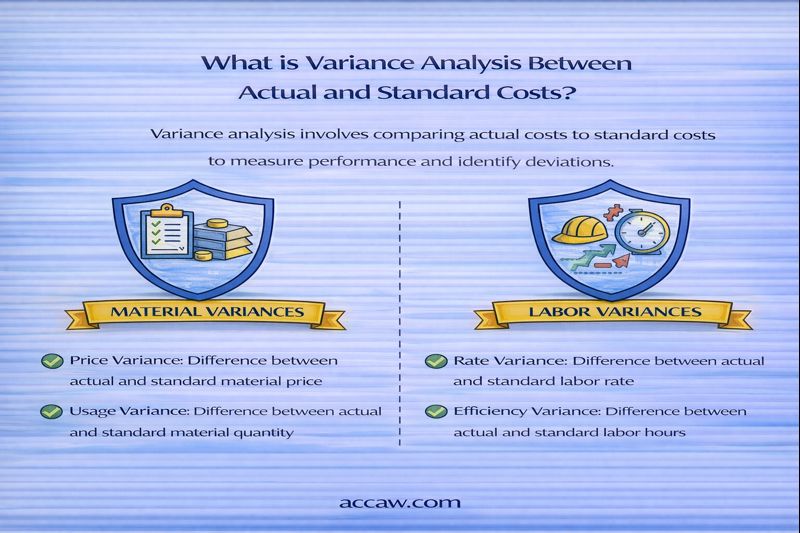
Summary: Variance Analysis is the process of comparing actual costs to standard costs and investigating the differences (variances) to understand their causes. Key variances include: Material Variances – Price Variance and Quantity Variance; and Labor Variances – Rate Variance and Efficiency Variance. Variances are classified as Favorable (F) (actual < standard) or Unfavorable (U) (actual > standard). This analysis is crucial for cost control and performance evaluation.
The Management Control Loop: Plan, Act, Compare, Correct
Variance analysis closes the loop in standard costing systems. It answers: "Where did we deviate from the plan, why, and who is responsible?"
1. The Foundation: Standard Costs
Standard costs are predetermined unit costs set for materials, labor, and overhead. They are based on: • Price Standards: What should be paid per unit of input (e.g., $5 per kg of material, $20 per labor hour). • Quantity/Efficiency Standards: How much input should be used per unit of output (e.g., 2 kg per unit, 1.5 hours per unit).
2. Material Variances
A. Material Price Variance (MPV)
Measures the difference between the actual price paid for materials and the standard price.
MPV = (Actual Price - Standard Price) × Actual Quantity Purchased
• Favorable: Actual Price < Standard Price (paid less).
• Unfavorable: Actual Price > Standard Price (paid more).
Responsibility: Usually the Purchasing Department.
B. Material Quantity Variance (MQV) or Usage Variance
Measures the difference between the actual quantity used and the standard quantity allowed for actual output, valued at the standard price.
MQV = (Actual Quantity Used - Standard Quantity for Actual Output) × Standard Price
• Favorable: Actual Quantity Used < Standard Quantity (used less).
• Unfavorable: Actual Quantity Used > Standard Quantity (used more, waste).
Responsibility: Usually the Production Department.
3. Labor Variances
A. Labor Rate Variance (LRV)
Measures the difference between the actual hourly rate paid and the standard hourly rate.
LRV = (Actual Rate - Standard Rate) × Actual Hours Worked
• Favorable: Actual Rate < Standard Rate (paid less per hour).
• Unfavorable: Actual Rate > Standard Rate (paid more per hour).
Responsibility: Usually the HR/Production Department (hiring, overtime decisions).
B. Labor Efficiency Variance (LEV)
Measures the difference between the actual hours worked and the standard hours allowed for actual output, valued at the standard rate.
LEV = (Actual Hours - Standard Hours for Actual Output) × Standard Rate
• Favorable: Actual Hours < Standard Hours (worked faster/more efficiently).
• Unfavorable: Actual Hours > Standard Hours (worked slower/inefficiently).
Responsibility: Usually the Production Department (supervision, skill, morale).
4. Comprehensive Example
Standard for one unit: 2 kg of material @ $5/kg = $10; 1.5 labor hours @ $20/hr = $30.
Actual for 1,000 units produced: Purchased/Used 2,100 kg @ $5.20/kg = $10,920; Used 1,550 labor hours @ $19.50/hr = $30,225.
Material Variances:
MPV = ($5.20 - $5.00) × 2,100 kg = $0.20 × 2,100 = $420 U
Standard Qty for Output = 1,000 units × 2 kg = 2,000 kg
MQV = (2,100 kg - 2,000 kg) × $5.00 = 100 kg × $5 = $500 U
Total Material Variance = $420U + $500U = $920U (Matches: Actual $10,920 - Std $10,000)

Labor Variances:
LRV = ($19.50 - $20.00) × 1,550 hrs = (-$0.50) × 1,550 = $775 F
Standard Hrs for Output = 1,000 units × 1.5 hrs = 1,500 hrs
LEV = (1,550 hrs - 1,500 hrs) × $20.00 = 50 hrs × $20 = $1,000 U
Total Labor Variance = $775F + $1,000U = $225U (Matches: Actual $30,225 - Std $30,000)
5. Interpreting and Using Variances
- Investigate Significant Variances: Focus on large $ amounts or percentages.
- Identify Causes:
- Unfavorable MPV: Inflation, poor purchasing, higher quality material.
- Unfavorable MQV: Waste, theft, poor quality materials, faulty machinery.
- Unfavorable LRV: Unplanned overtime, use of higher-skilled workers.
- Unfavorable LEV: Poorly trained workers, low morale, machine breakdowns, poor quality materials causing rework.
- Take Corrective Action: Address the root cause (e.g., re-train workers, change suppliers).
- Performance Evaluation: Hold responsible managers accountable.
6. Conclusion: The Engine of Cost Control
Variance analysis transforms accounting data into actionable management information. By breaking down total cost differences into price and quantity components, it pinpoints exactly where and why performance deviated from plans. This enables timely corrective action, continuous improvement, and better accountability, making it an indispensable tool for effective cost management.